The KPI Dashboard: Your control center for cyber risks.
Key risk metrics for security, IT, and management.
SEQIFY turns complex security data into clear KPIs for better decisions.

The KPI Dashboard is the brain of the SEQiFY platform.
It shows at a glance how your cyber risk is evolving, where action is needed, and which measures are having an impact. No more unclear reports - just a single source of truth for everyone involved.
SEQIFY turns data into real metrics, highlights deviations immediately, and generates real-time KPIs.
The KPI Dashboard was developed for CISOs, CIOs, risk managers, and IT leadership - using language that everyone understands.
The strengths of the KPI framework
Preconfigured KPI framework
All KPIs are ready to use: clearly defined, consistently calculated, and robust enough to withstand audits.
SEQIFY provides a comprehensive set of risk KPIs that are ready to use without the need for custom modeling. Each metric is clearly defined, compliant with industry standards, and documented in an audit-proof manner - ensuring reliable reporting right out of the box.
Real-time insights instead of static reporting
Risks, deviations, and trends are always up to date - not just on reporting dates.
Instead of relying on static reports based on specific dates, SEQIFY works continuously with real-time data. Changes in the risk profile become immediately apparent - enabling timely decisions and targeted actions.
Trackability & Auditability
Each metric with a defined measurement method, formulas, and data source.
All KPIs are structured transparently: formulas, data sources, and versions can be traced at any time. This simplifies audits, reduces the need for follow-up questions, and establishes clear governance.
Risk-Based Trend Analysis
Determine whether risks are increasing or whether security measures are effective.
SEQIFY tracks trends over time and highlights where risks are increasing or decreasing. This allows you to evaluate measures and set priorities based on solid data.
All relevant metrics for management, CISO and IT
SEQIFY clearly shows where risks arise, how they develop, and which measures are truly effective - without the need for manual analysis or Excel comparisons.
Selection of ready-to-use KPIs
All KPIs are available for immediate use - with no implementation effort, no manual calculations, and no lengthy setup time.
Central KPIs instead of manual calculations
All key metrics are automatically calculated, standardized, and presented consistently - without the need for manual data searches or Excel calculations.
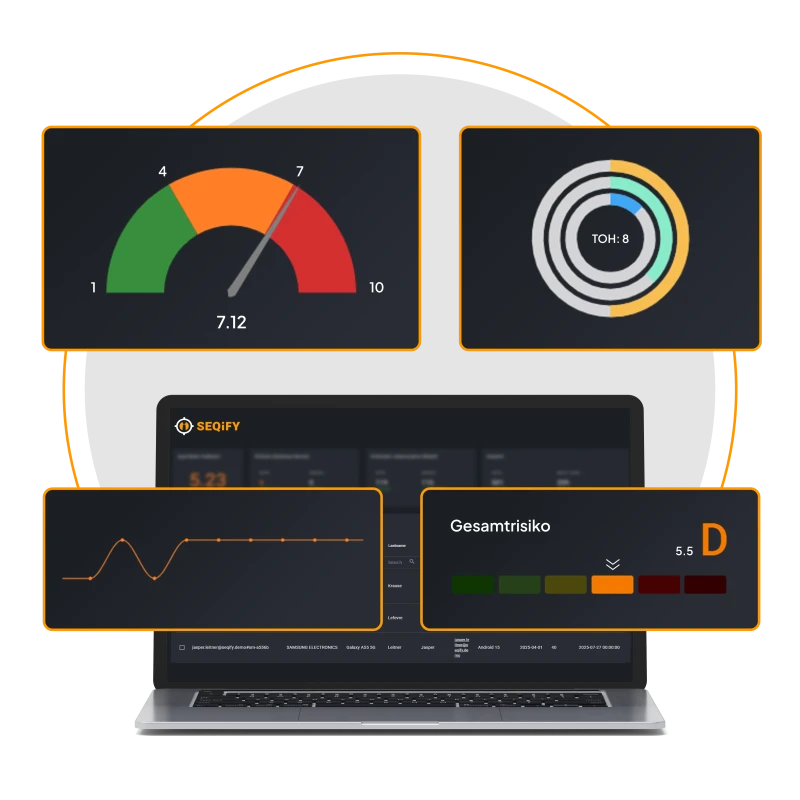
Key Risk Metrics at a Glance
Critical devices, patch compliance, system end-of-life, or awareness status—can be displayed individually based on the user or role.
Trend lines for long-term monitoring
Time series show whether risks are increasing or decreasing - and how effective measures actually are.
Target vs. Actual Comparison
Defined target values for each KPI make progress and deviations immediately apparent and help ensure that business goals are met
Transparent KPI definitions
The measurement method, formula, and data source are directly accessible—audit-proof and compliant with DORA, ISO 27001, and other standards.
Technical details in the drill-down
All KPIs are linked to technical details - enabling informed decisions and concrete action planning
Visualization suitable for management
Clearly structured presentations, ideal for board reports and C-suite meetings
Clearly identify variance
Fluctuations, outliers, and anomalies in KPIs become immediately apparent - enabling a more precise assessment of risk dynamics.

Better decisions in less time
With SEQIFY, executives get an immediate, clear view of risk trends, critical deviations, and priorities. No manual reports, no sifting through Excel spreadsheets—just easy-to-understand visualizations for the decisions that matter.
KPIs that provide clarity
Whether it’s critical systems, end-of-life assets, or awareness status, SEQIFY shows at a glance where operational risks arise and which measures are effective. KPIs can be displayed flexibly depending on the user’s role.
Take immediate action based on KPI insights
Each metric provides a direct link to the technical details in the drill-down - including affected assets, vulnerabilities, and responsibilities. This allows specific actions to be derived from the data and initiated.
KPIs that SEQIFY provides immediately
SEQIFY provides preconfigured, well-founded KPIs—effortlessly and ready to use right away.
(8 examples)
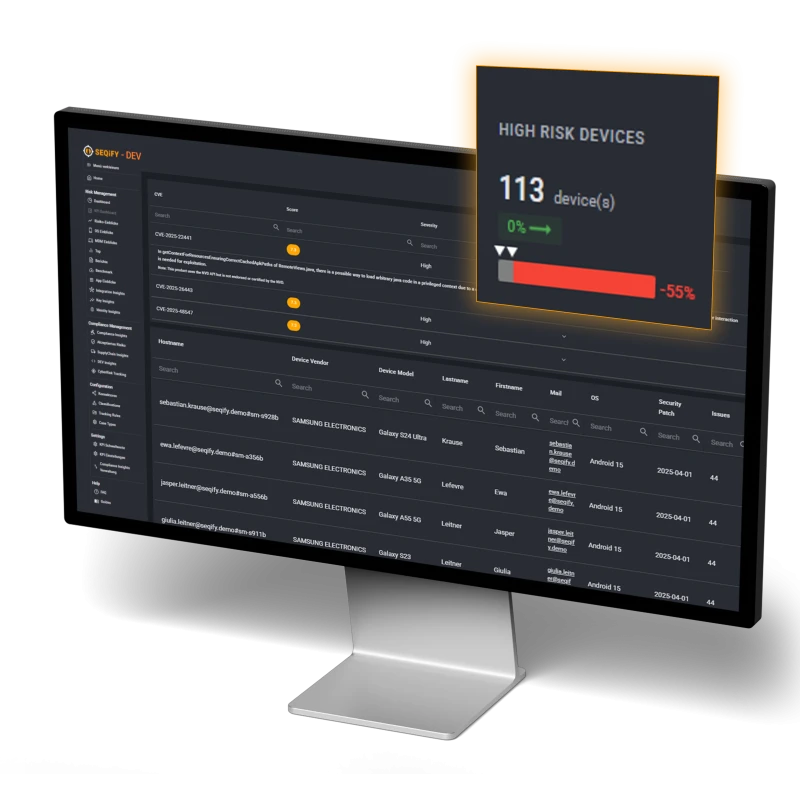
Critical Devices
Which assets are at immediate risk?
Critical Devices identify which systems pose a high or critical risk—based on risk score, asset criticality, and exploitability.
Critical Risks > 3 Days
Which critical risks remain unresolved for too long?
Measures critical findings that have not been resolved for more than three days.
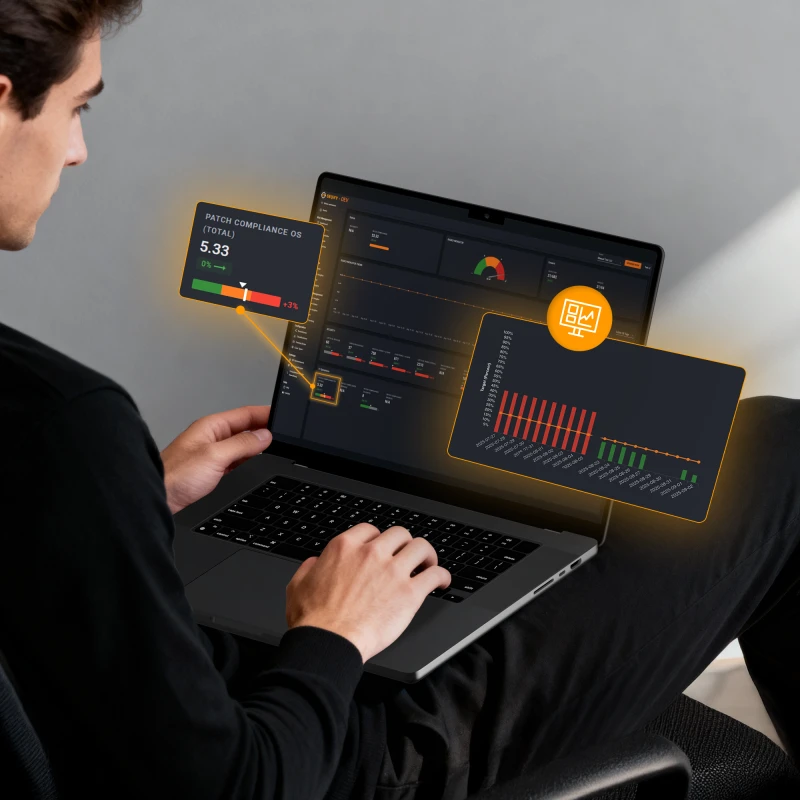
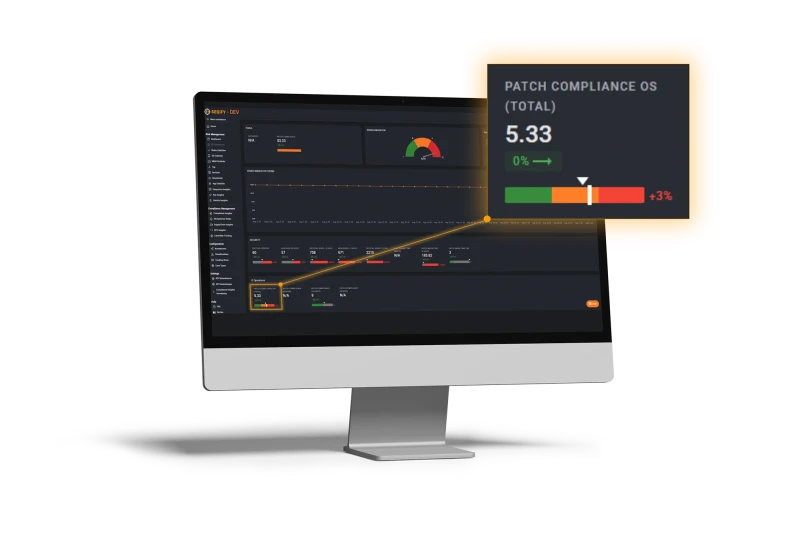
Patch Compliance
How quickly and effectively are vulnerabilities addressed?
Measures the percentage of systems that were patched within the defined timeframes.
Systems End of Life (EOL)
How many systems are running without manufacturer support?
SEQIFY automatically identifies EOL systems and assesses their risk.
Lost Devices
Which systems are no longer active?
Identifies how many and which devices are inactive or lost.
Patch Mean Time
For Servers / Clients / CVE
Shows the average time taken to resolve a vulnerability—broken down by system type or CVE.
Awareness Training Rate
How well informed are employees about cyber incidents?
This metric shows the percentage of employees who have completed the mandatory training.
Managed Systems
How comprehensive is the asset coverage?
Shows which systems in SEQiFY are used to collect risk data.